Toronto Market Report - August 2022
Posted on Aug 18, 2022 in Market Report
Sales Commentary
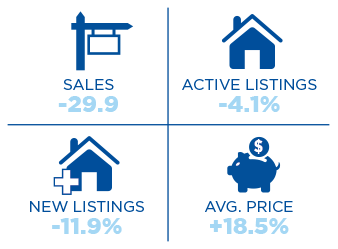
Can this market get any slower? Sales for July on TRREB were 4912 units. This was down 47% from July of last year, but more importantly to market watchers, down 24% from June. This marks four consecutive months of sale decreases. If there is a sliver of hope, ‘active listings’ for July are 5% lower than June, even with weaker sales...Toronto Market Report - July 2022
Posted on Jul 13, 2022 in Market Report
SALES COMMENTARY
Sales on the Toronto Regional Real Estate Board in June were 6474 units. This was the lowest sales month in 18 months (not counting December). The question is: when will we reach the bottom?Trying to predict the top or the bottom of any market is difficult. The best one can do is follow the trends and watch for a reversal. You can...
Toronto Market Report - June 2022
Posted on Jun 15, 2022 in Market Report
SALES COMMENTARY
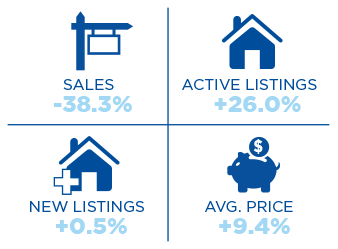
 Everyone wants to know when we reach the top and the bottom of a real estate market. The reality is that you only know these points after the fact. About a month later. For the public, it is all about prices but for the real estate industry, we also focus on the volume of sales as an indicator too.
 Sales in May on TRREB were down 38...
Toronto Market Report - May 2022
Posted on May 18, 2022 in Market Report
Sales Commentary
 Let us hope no one was waiting for the Spring market! April sales at 8,000 units were 27% lower than in March. To gain perspective, the March to April decline in 2021 was 13%. The importance is that sales in March will be the peak month for both 2021 and 2022. Also, we are now forecasting year-end sales will be down about 22% from 2...
Toronto Market Report - April 2022
Posted on Apr 30, 2022 in Market Report
SALES COMMENTARY
 Looking at March numbers is like looking in the rear-view mirror. Sales at 11,000 units were down 30% from March a year ago which was the biggest sales month in 2021. Our guess is that March this year will be the biggest sales month of 2022.
Everyone wants to know what will happen for the balance of the year. As you recall, we foreca...
Toronto Market Report - March 2022
Posted on Mar 24, 2022 in Market Report
SALES COMMENTARY
 February sales on TRREB followed the trend from January. At 9097 sales, this was 17% lower than for January of 2021. Another way to look at these numbers is that the sales jump from January to February due to seasonality was 61% in 2022 compared to 58% in 2021. In other words, we are tracking in line with last year. Yes, sales are l...