SALES COMMENTARY
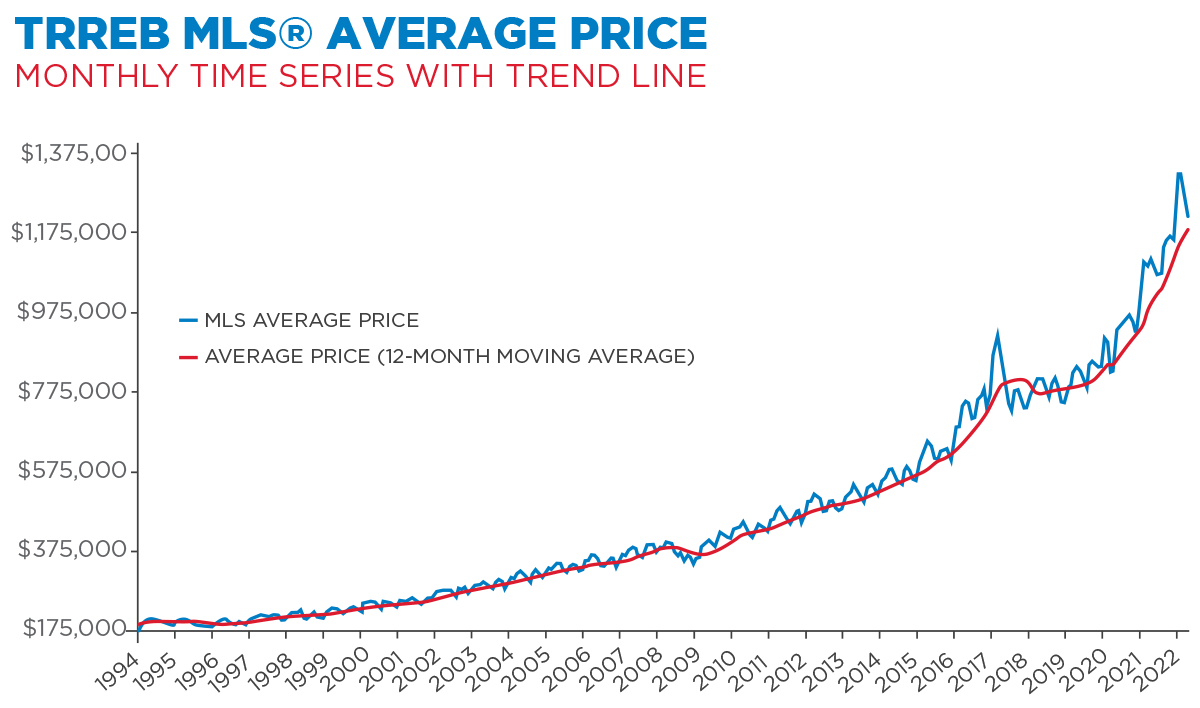
 Everyone wants to know when we reach the top and the bottom of a real estate market. The reality is that you only know these points after the fact. About a month later. For the public, it is all about prices but for the real estate industry, we also focus on the volume of sales as an indicator too.
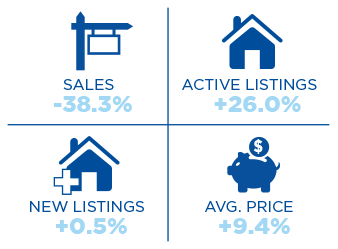
 Sales in May on TRREB were down 38% from May a year ago but they were down only 9% from April. Last year, the decrease from April to May was 13%. It will be interesting to track the May to June drop this year as compared to 2021 when it was just 7%. This may give us an indicator if sales will level off by September.
The big concern is how high will mortgage rates rise? We see some short-term pain but looking at the 5-year bond yield (the basis of the 5-year fixed mortgage) and the 10-year bond yield there is very little difference. That means investors are betting that in 5 years' time, rates will be the same as today. Going forward, what will support housing prices is the replacement cost for new housing (it will only be more expensive) and the move back/preference into the GTA.
COMPARING AVERAGE PRICES
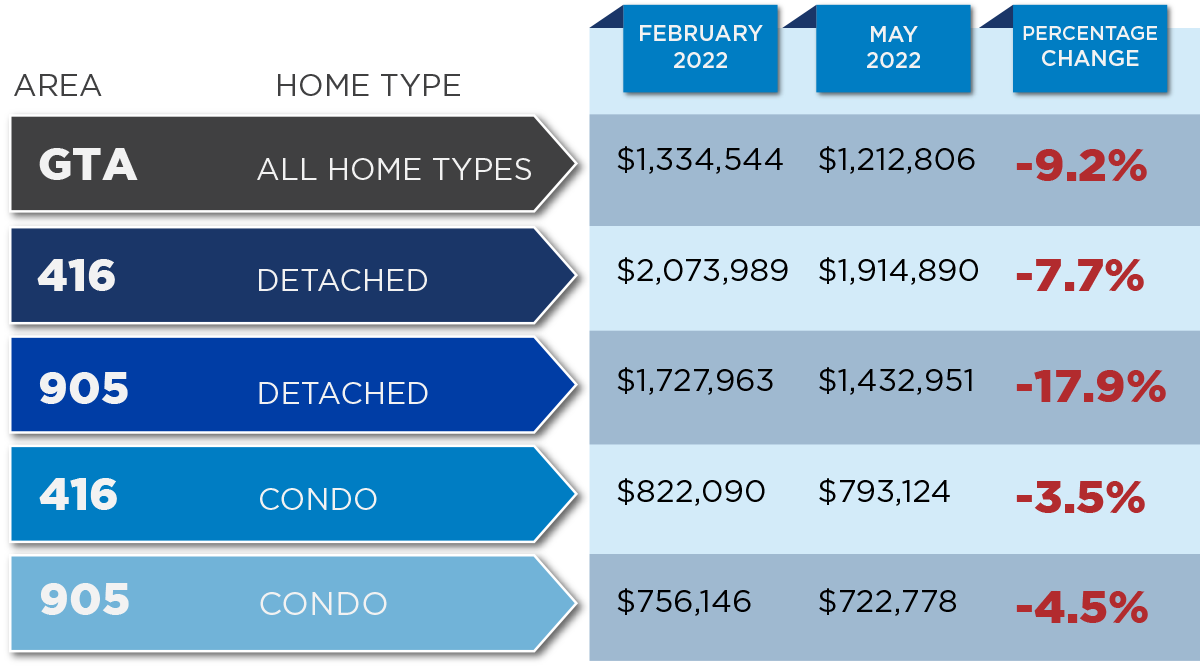
One of the worst statistics to use with pricing is the ‘average’ price. It assumes that when comparing different time frames, the mix of sales does not change. A simple example: last year there were 2 sales – one at a million and one at $500,000. The average sale price was $750,000. This year there were 2 sales – both for the same $500,00 unit but they now sold for $600,000. The average price today is $600,000 and the press will report a drop in average prices of $150,000. The reality is that prices went up by $100,000.To better understand the actual size of these decreases, we show average price by area and by property type. The range of price decreases is from 3.5% to 17.9 %, while the media reports 9.2% for the GTA.

Source: Toronto Regional Real Estate Board

Source: Toronto Regional Real Estate Board
RENTAL COMMENTARY
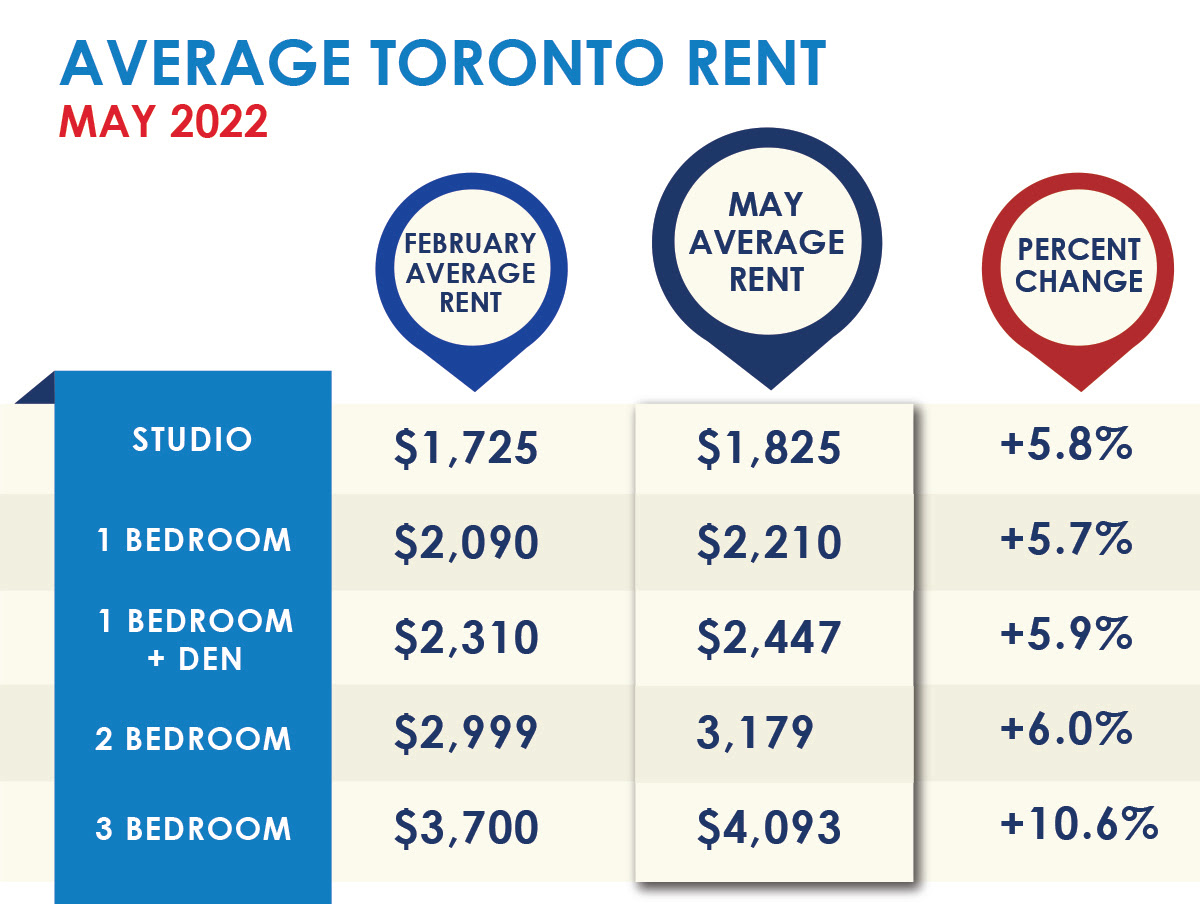
It seems like everyone has decided to rent and not buy! Over 2100 condo units were leased in the Downtown and Humber Bay markets in May. Currently there are only 1250 ‘active’ listings for lease – meaning less than a 17 day of supply. Going forward this market will only get tighter as we approach the peak July and August months when students will add to the demand for condos. Currently we are experiencing multiple offers on rentals and the lease price to list price is now at 102%!. For vacant condos, rents will continue to increase. The table below shows the increase in average rents by unit from February until May 2022.