UNDERSTANDING WHAT HAPPENED IN 2023
2023 was actually two markets in one. First when mortgage rates stabilized in January, buyers jumped back into the market and prices rose by about 2-3%. In June the Bank of Canada started increasing rates again. Uncertainty about rates and not just the level of rates caused buyers to move to the sidelines. The result was drastically lower sales and prices declined again in the second half of the year.WHAT TO LOOK FOR IN 2024
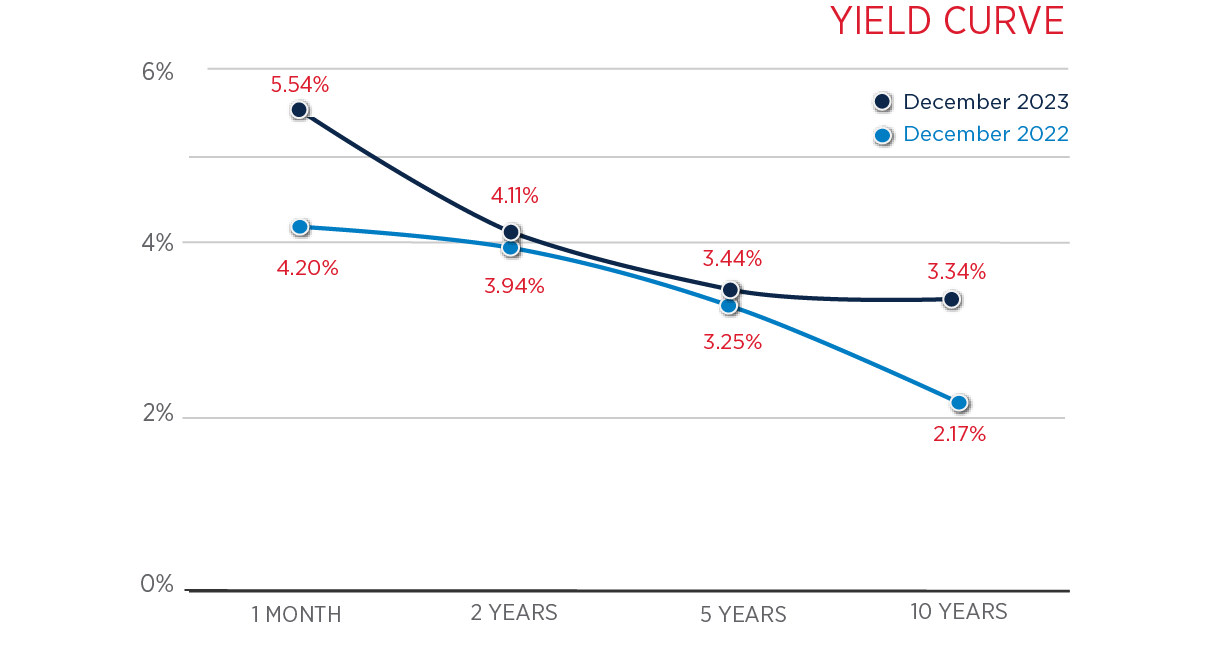
1 Again, this will be year of two markets. The first half will be slow, with prices dropping by a further 2-3% on average. When mortgage rates start to fall, not all buyers will re-enter the market, as some will wait for rates to fall further.2 Five Year fixed-rate mortgages are currently at 5.6%. Expect these rates to end 2024 at 4.5%. Variable rate mortgages are currently at 7%, but should also drop to 4.25%.3 Unemployment is now at 5.8% (it was 4.5% in 2022). We are heading into a recession. Just look at our yield curve from year-end to 2022 to the current one.4 Continued population growth of one million people a year (500,000 immigrants and the rest refugees and international students) will increase the demand for housing. 50% of these people are coming to Ontario.5 Housing completions are averaging 220,000 per year and Ontario makes up only 35% of this total.6 Don’t expect a surplus of listings from sellers to solve the housing shortage. The Mortgage arears (over 3 months) number in Ontario is higher (.10%) than the last two years, but it represents only 2200 houses in total.
YIELD CURVE: THE ECONOMY IN A NUTSHELL
A Yield Curve compares interest rates of the same risk level (Government Bonds) over various terms. In a normal market, long-term rates are higher than short-term rates for the added risk factor. When interest rates invert (short term higher than long term) it is a strong indicator that a recession is near. Previously we had an inversion in 2008 which forecast a recession and a minor one in 2018. This time the inversion is quite substantial, indicating a bigger recession. We tracked the Yield Curve for December 2023 versus December 2022. The deficit this time is 2.2% versus 2.03% last year and unemployment is increasing.Source: Toronto Regional Real Estate Blog
SALES FORECAST FOR 2024
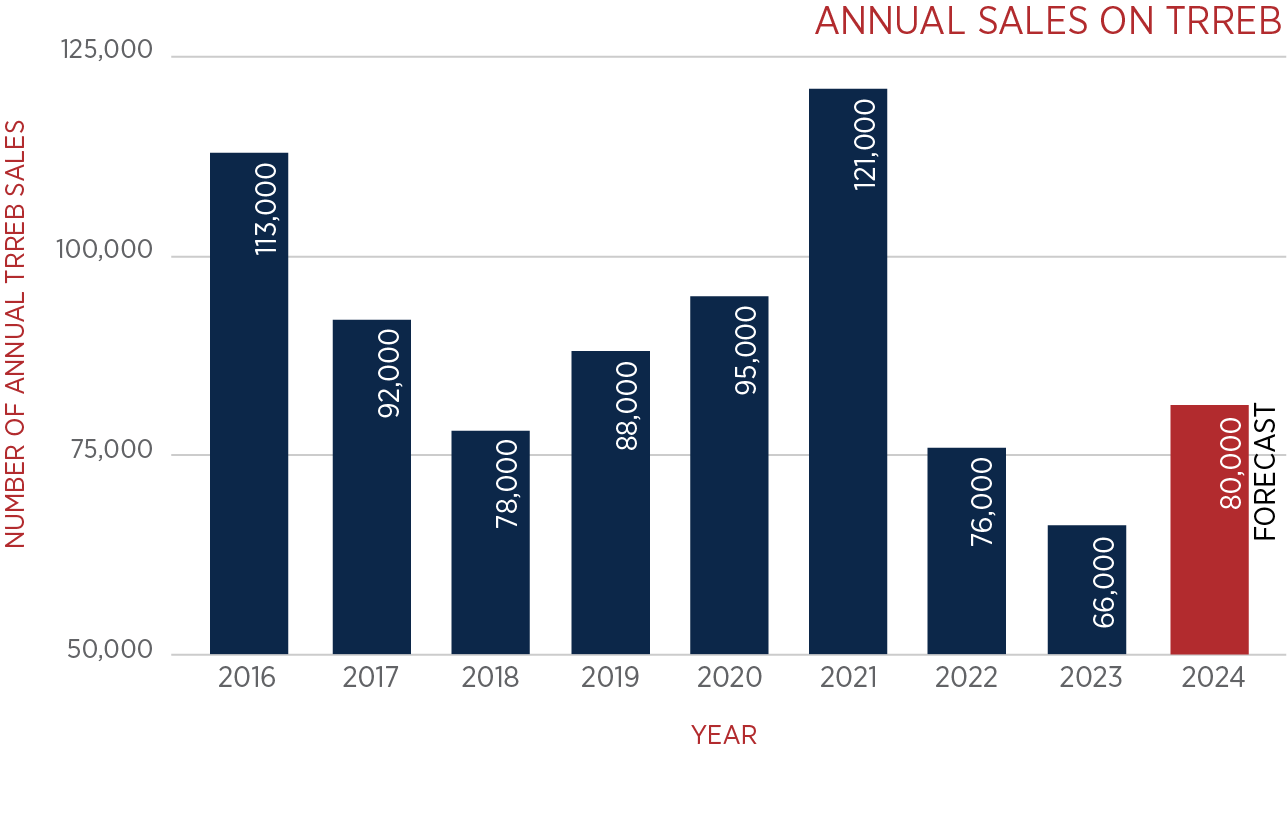
Historically sales are a lead indicator for price increases. Over the last 9 years, we have averaged 92,200 sales. In 2023 the number was 65,000. For 2024 we are forecasting 80,000 sales. This forecast is in line with 2018 when we experienced our last minor recession and market correction. Look for sales to accelerate in the latter half of 2024. Source: Toronto Regional Real Estate Board
REAL ESTATE PRICES
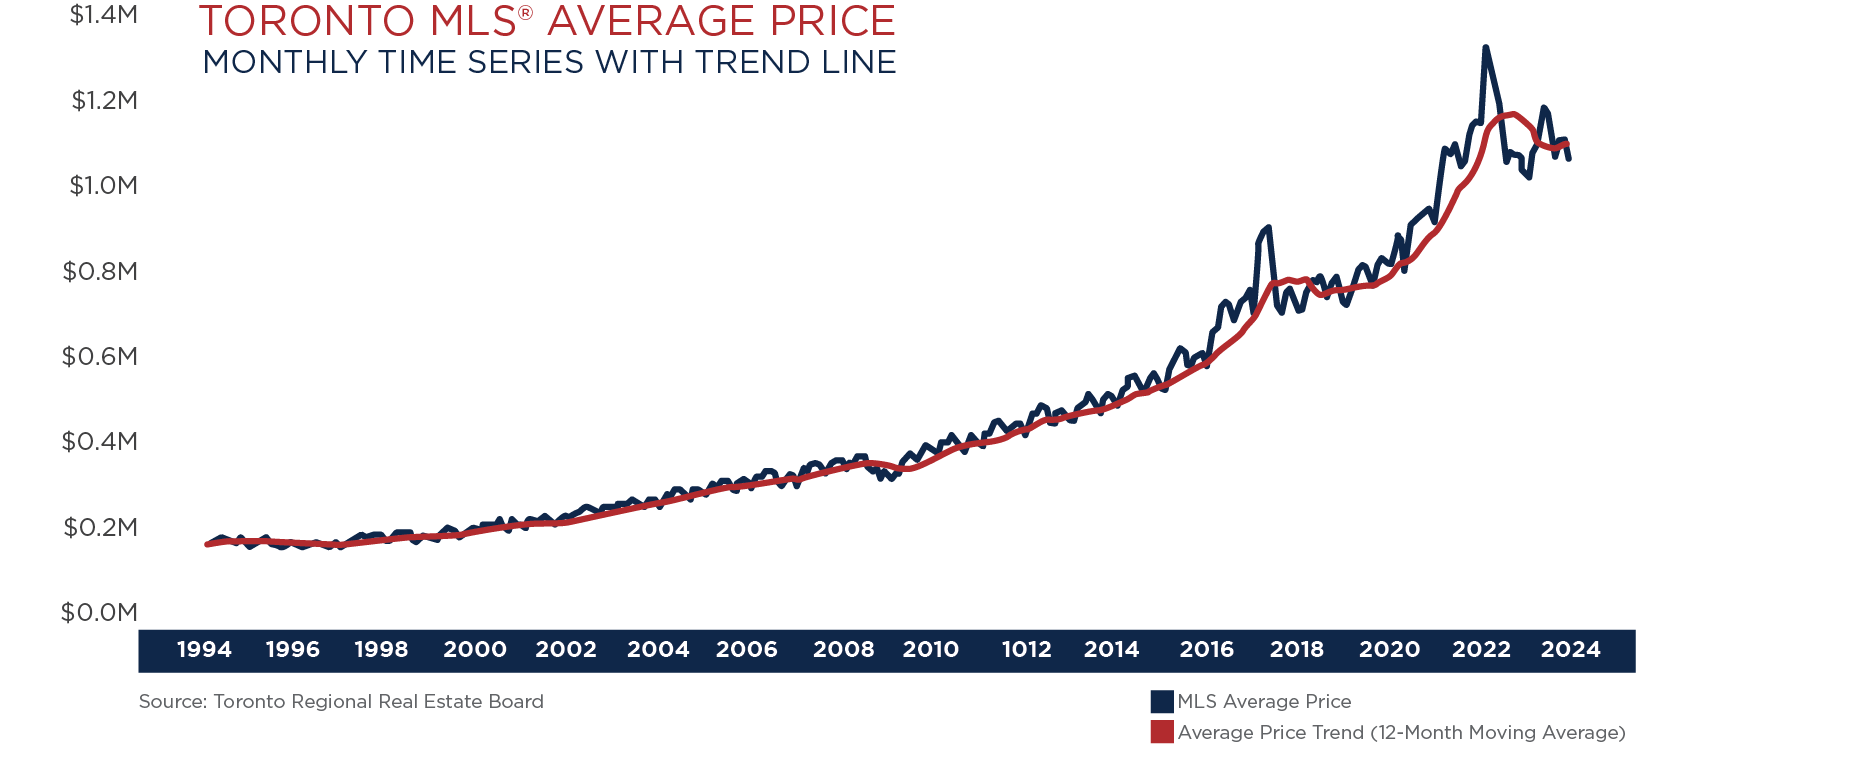
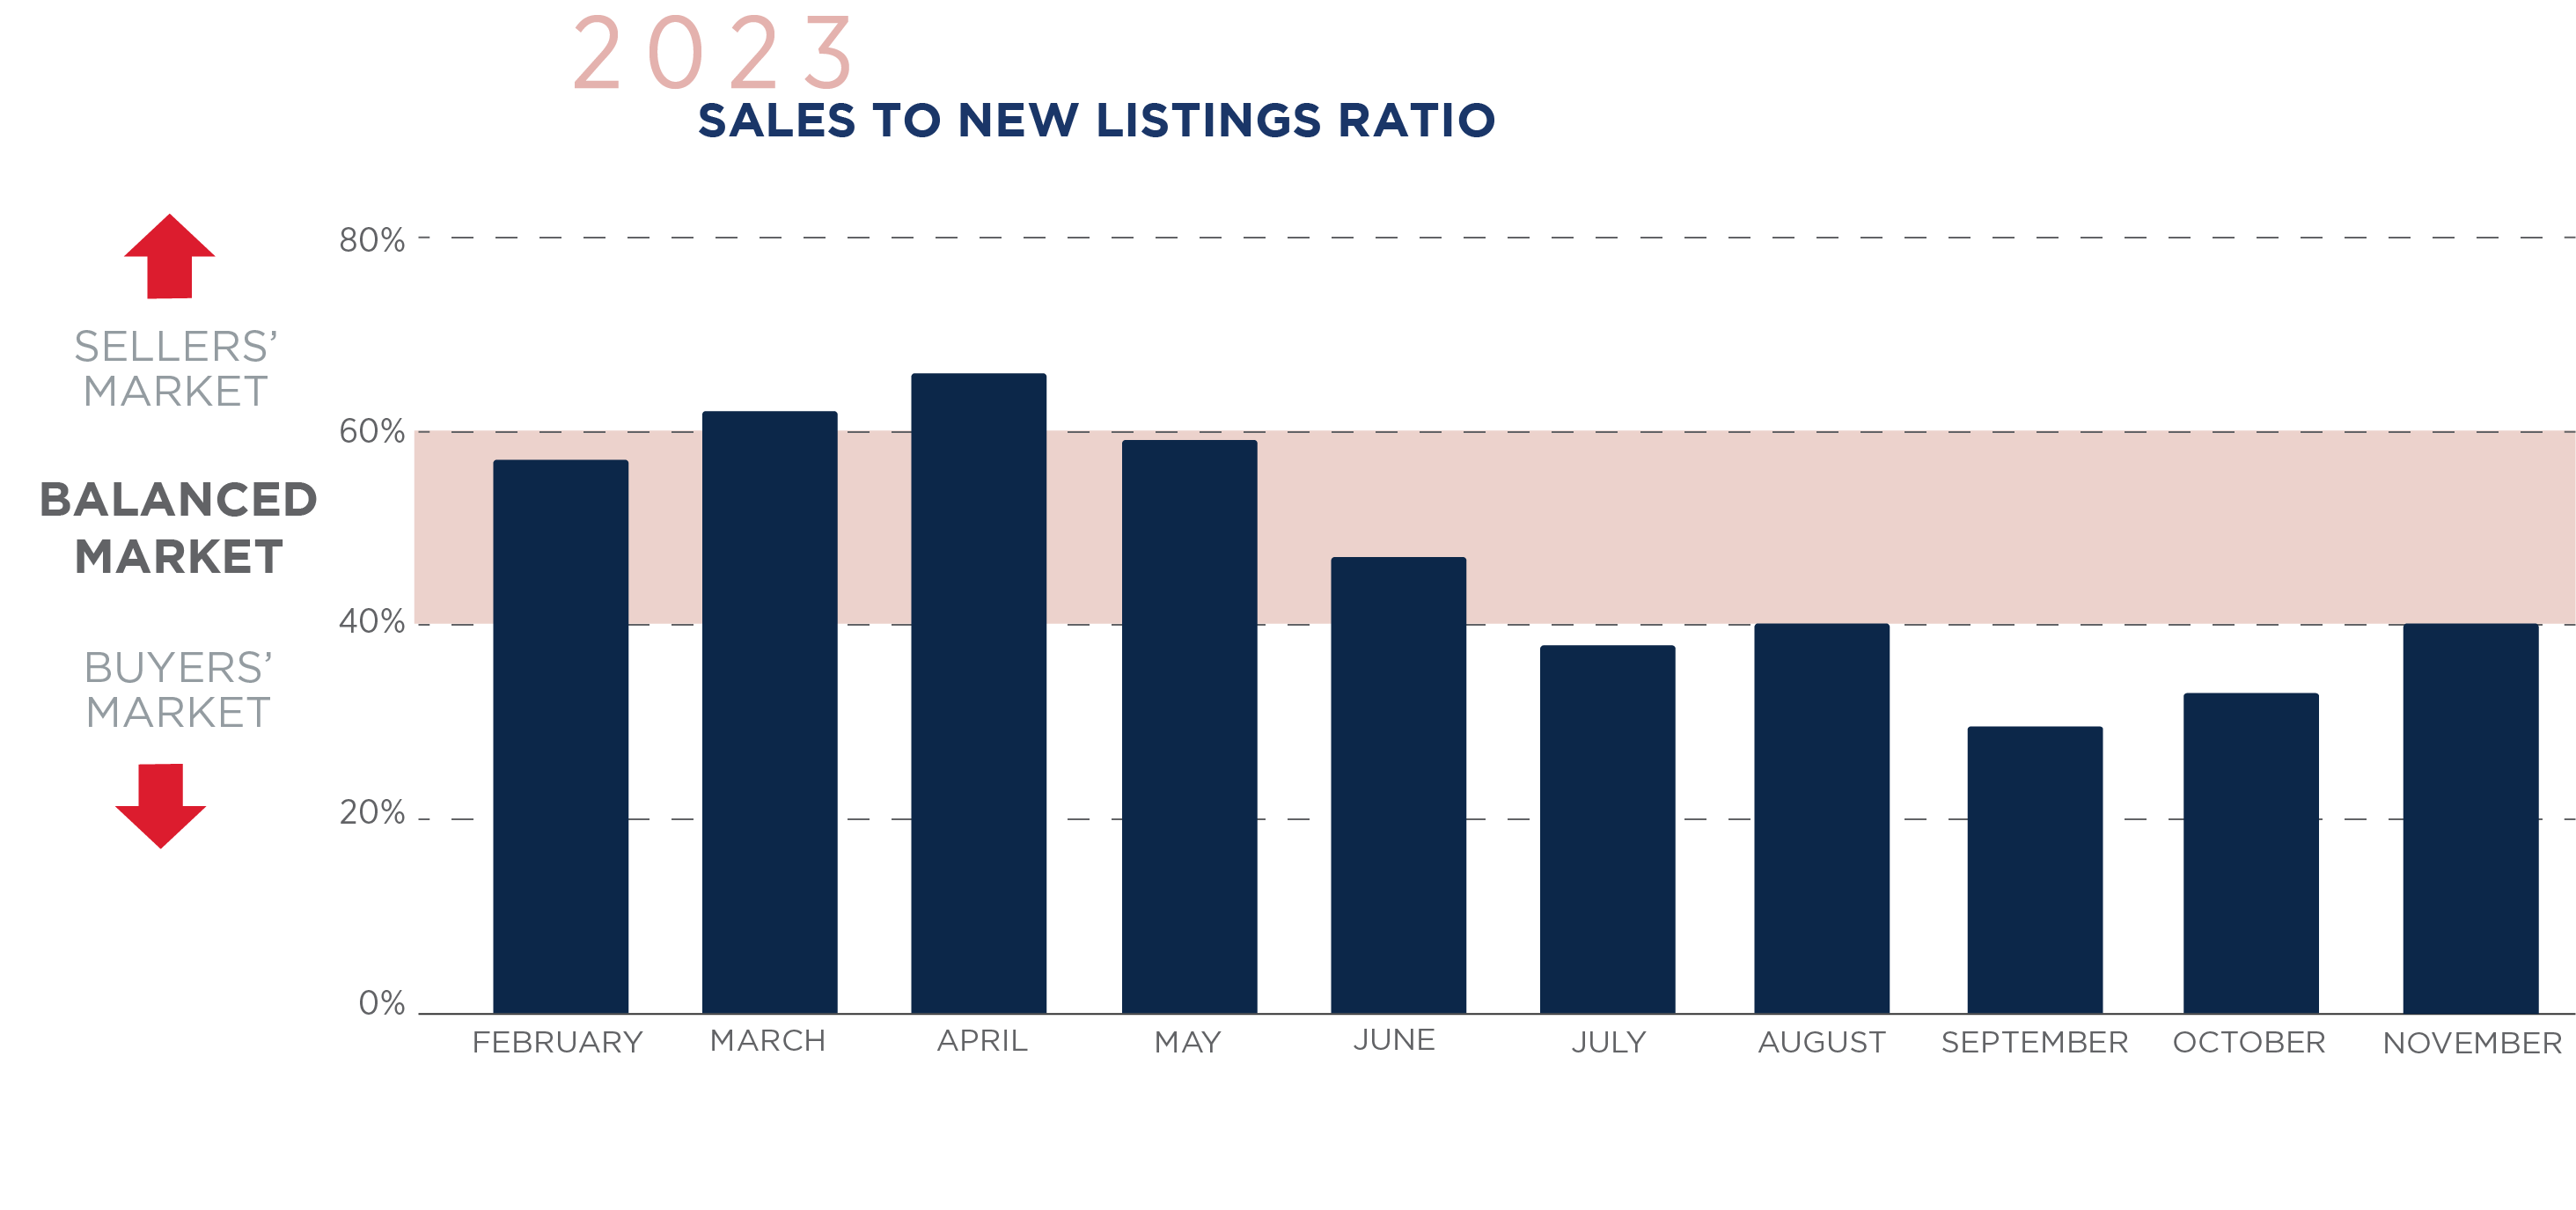
Historically, real estate prices increase by 4% per year. Two factors are responsible for this: the cost of new housing which is always higher than resale due to inflation; and Immigration which increases the demand for housing.From 2019 to 2021 we have seen price increases of 30-40%. This was followed by a decrease of 15-20% in 2022. In 2023 average prices declined by another 4-6%. The net effect is an average annual increase of 3%. We are forecasting that price increases will continue to fall in the first half of the year. The indicator is the sales-to-new listings ratio which is currently in a ‘buyers market’. They will rebound in the second half of the year and prices will be 2% higher than currently.
THE BEST PERFORMING PROPERTIES WILL BE:
1 Detached2 Properties on side streets not main arteries3 Properties with bigger lots4 Condos with superior public transportation5 Condos with preferred views and outdoor spaces